This post aims on a brief explanation of some Twitter metrics that have been published. While this is the first post regarding this topic in this blog, some general explanation will be made in advance to understand where the application of Twitter metrics is located in an evaluation based on Twitter.
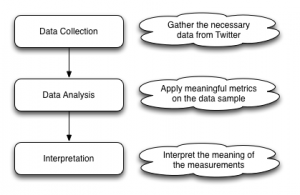
In general, you have to perform the three steps you can find in the following figure to conduct an evaluation based on Twitter (or any other platform).
Data collection: The first step is to gather the necessary data for your evaluation. Therefore, you have to know what data are necessary for your evaluation, and if and how you can acquire them from Twitter. The gathering of Twitter can be undertaken e.g. through the Twitter API. However, you will possibly have to accept some trade-offs because of request limits.
Data Analysis: While you may find already some of the collected data interesting or meaningful by itself (e.g. amount of followers) the calculation of metrics will be give you the meaningful insights that you need for your evaluation. This means that you calculate from the raw data you have collected some variables, comparisons, and/or changes. For example, you may want to show how the Twitter followers of a user increase over time compared to the amount of Tweets the users publishs.
Interpretation: Based on the metrics that you have calculated, you make interpretations that lead to the resulting conclusions of your evaluation. For example, you may come to the interpretation that one Twitter account is more influential than another but the influence of the second is growing faster.
While you would perform the steps for your evaluation in the order from collection to interpretation, the planning has to be undertaken the opposite direction. Based on the aim of your evaluation you have to decide what interpretation you will need, what metrics are therefore necessary, and what data has therefore be gathered.
After this explanation of the general evaluation process, some Twitter metrics should be explained.
I want to start with some interesting metrics that the guys from Simply Measured explain in their Complete Guide to Twitter Analytics:
- Engagement: “Engagement on Twitter accounts for every way followers can interact with your brand to make it show up in their timeline.”
It’s calculated as Engagement = @Replies + Retweets + Mentions + Favorites
Additionally, you can include into your considerations of engagement also hashtags (e.g. in campaigns). - Potential Reach: “The potential reach metric allows you to quantify not only the users you engaged with, but also the followers of those users who may have seen your @handle or Tweet.”
It’s calculated as Potential Reach = sum of all users mentioning your brand + sum of their followers - Potential Impressions: While Potential “Reach accounts for the possible number of people who may have seen your content, […] impressions calculates how many times the people you’ve reached have seen your content.”
It’s calculated as Potential Impressions = Total number of times a Tweet from your account or mentioning your account could appear in users’ Twitter feeds during the report period. It includes your Tweets, Tweets that mention your brand handle, and retweets of your content.
- Response Rate: Response Rate calculates how lilkely the account replies to tweets that mentions the account.
It’s calculated as Response Rate = Total # of Mentions Replied to / (Total Mentions – Retweets)
(Verbally: Number of inbound mentions of your brand handle that you’ve responded, divided by the sum total of all brand mentions) - Response Time: It calculates how fast the account replies to inbound tweets.
It’s calculated as Response Time = Time of @Reply to inbound Tweet – Time of inbound Tweet - Interactions per person: It calculates “[…] how involved your audience is as a whole”.
It’s calculated as Interactions per person = Total Interactions / Total Audience
